Pipeline logic
- Roughly recognize what is a signal coming from cardiomyocytes and use it for mask (Primary object:
cells) - Identify nuclei in the sarcomere signal masked image (Primary object:
CM_nuclei) - Merge close-by nuclei as one object (SplitOrMergeObjects:
CM_nuclei_merged) - Segment sarcomere signal channel into cells based on the merged nuclei (Secondary object:
cells_final) - Now there are 3 different objects
- nucleus (Primary object)
- cytoplasm (Tertiary object)
- cell (Secondary object)
- Measure YAP1 signal in nucleus, cytoplasm, and cell
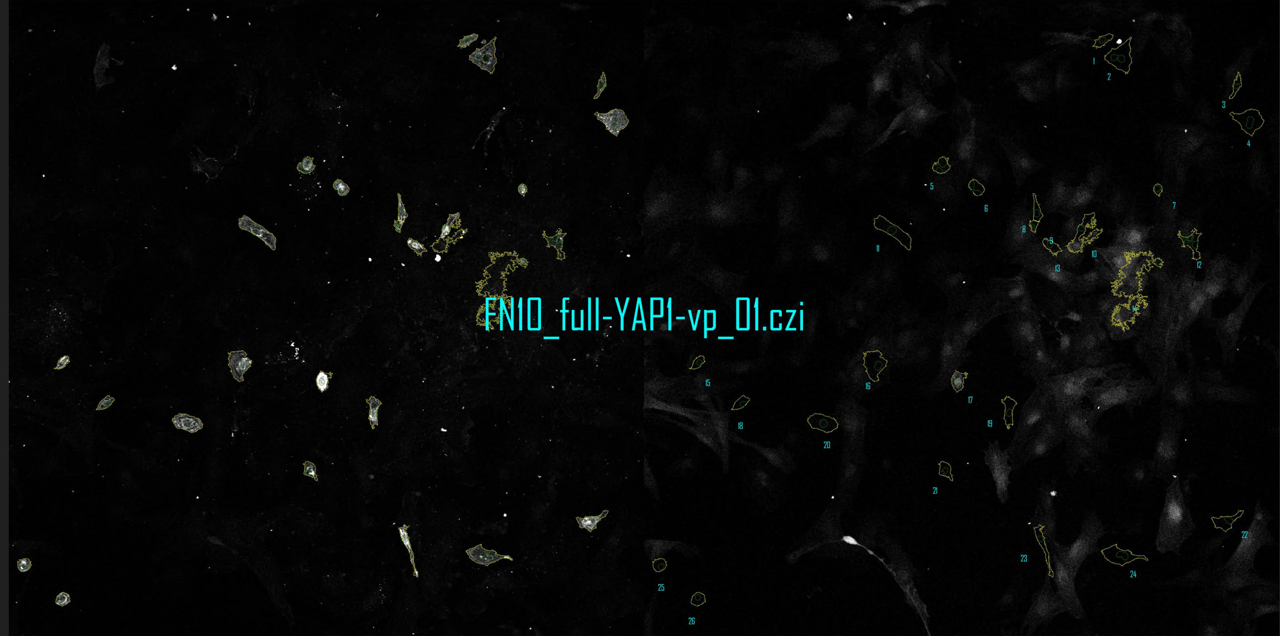
- Save image for checking cell segmentation:
- Left: Sarcomeric signal overlayed with
CM_merged_nucleicells_final` outlines - Right: YAP1 signal overlayed with
CM_merged_nucleiandcells_finaloutlines - object numbers
- Save files with measurements, set that all measurements are exported
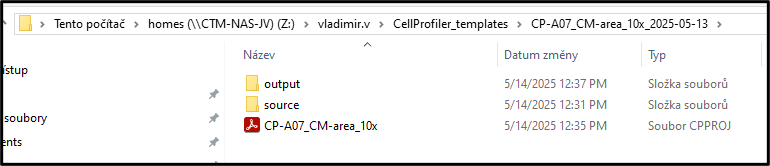
Reproducible structure of the project
sourcefolder contains all the imagesoutput_<group-name>folders where output from different pipelines goCP-<Pipeline-ID>_<group-specification>one or more pipelines with clearly indicated what group was which pipeline used on
Pipeline Quality control
- Go throgh the exported overlays and check for segmentation
- If there are some really badly segmented cells (more then 5% per image) remove them from the measurment files
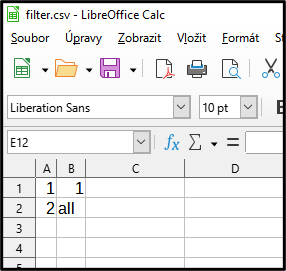
- create a filter file:
- first column for image number, second column for object number to be removed
- in case of all to be removed write
allin second column - save and run the filterCP script on the files to remove the files
- Add
QC-passedto alloutputfolders which were checked - Check the number of columns
cells_final.csv(BJ last column)CM_nuclei_merged.csv(BL last column)
Post processing
- Stack all the
cells_final.csvandCM_nuclei_merged.csv
csvstack -g *cells*final*.csv > cells_final.csvcsvstack -g *CM*merged*.csv > CM_nuclei_merged.csv
-
Select the columns for intensities and ratios in the
CM_nuclei_merged.csvand add them to the end ofcells_final.csvselectR -c 1,40,47,63 CM_nuclei_merged.csv -
Rename the columns to:
YAP_nucleus_Int-IntYAP_nucleus_Mean-IntYAP_ratio_Int-IntYAP_ratio_Mean-Intscale_umperpx(fill in 0.55 for all)Area_Scaled(0.550.55 AreaShape_Area)
-
Create the columns for the experimental conditions and groups (new columns 2-4, manually fill in the values)
ExpNoExpGroupCoating
- save as
data_final_all-cols.csv
Data analysis
- Select only the relevant columns from this file
selectR -c 1-4,7,6,42,49,69-72 data_final_all-cols.csv
-
rename to
data_final_selected-cols.csv -
Run descriptive statistics
summaryR -c 2-4 data_final_selected-cols.csv
- Weed out the non-necessary columns
selectR -c 1-4,10-12,15-17,20-22,25-27,30-32,35-37,45-47 summary_*.csv
Save as summary_statistics.csv
- In excel sort the files by ExpGroup, Coating, ExpNo, this way you can copy into the grouped graph
- select grouped graph
- replicates = 3
- Group A -fill
FN1, Group B fillFN10 - In rows put
WT,mock,full-YAP,dPDZ - use
ctrl+shift+Tto transpose the values when copying
Example files
Pipeline (works on version 4.2.7)
Output files
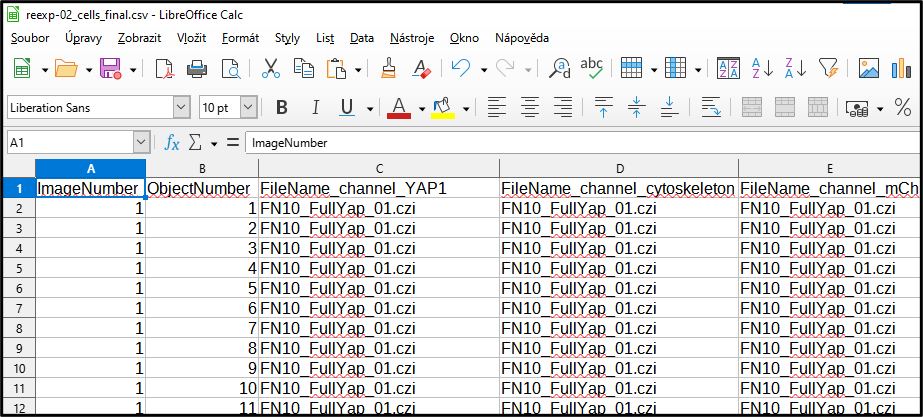
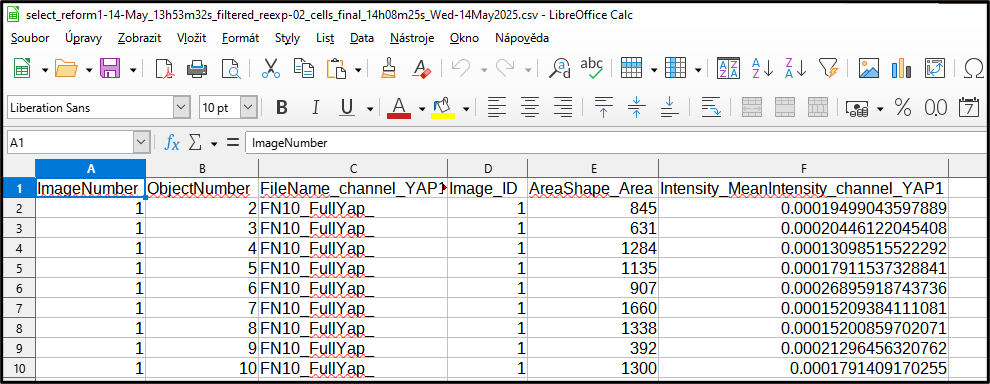
Output cells_final.csv file with measurment data
Post-Processing
Output cells_final.csv file with all images and objects
Example Filter file removes first object in image “1” and all objects in image “2”
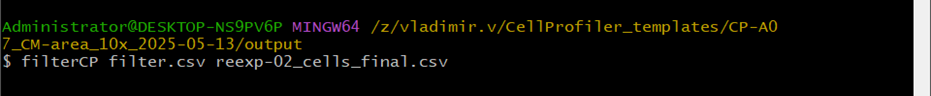
Filter command
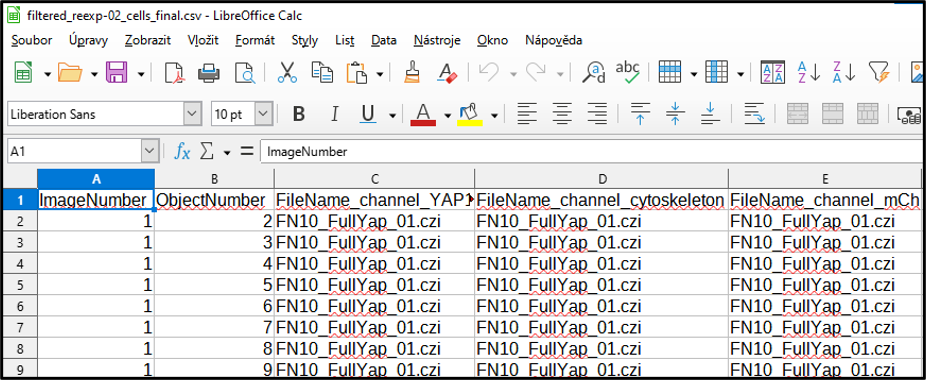
Cells_final.csv file after filtering
This filter removes first object in image 1 and all objects in image 2
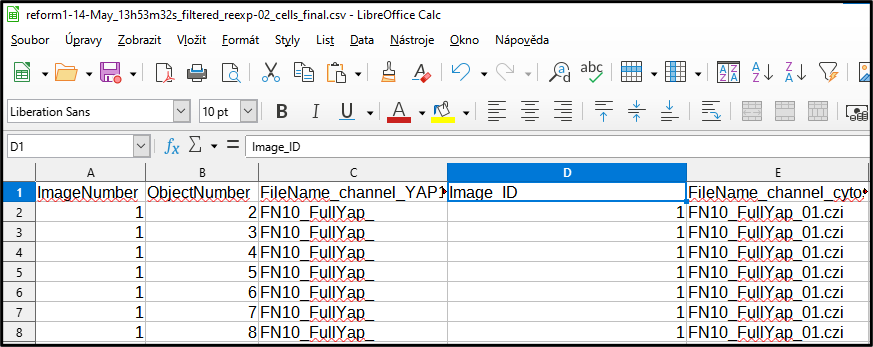
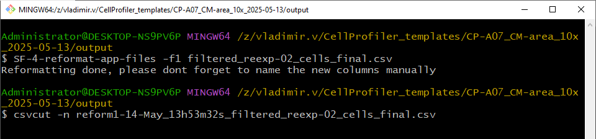
Split the name of the file into an experimental condition and image number
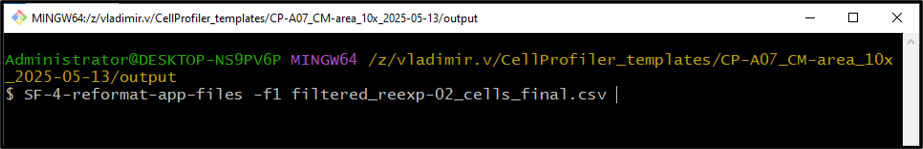
Output of the reformatting script
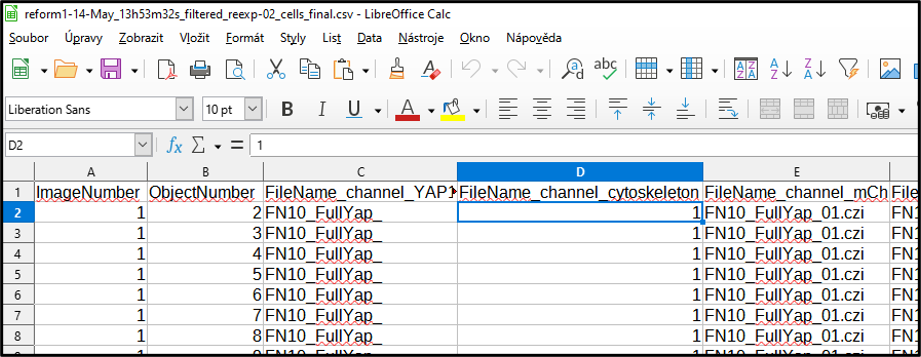
Add a new column name to the Image number split from the name
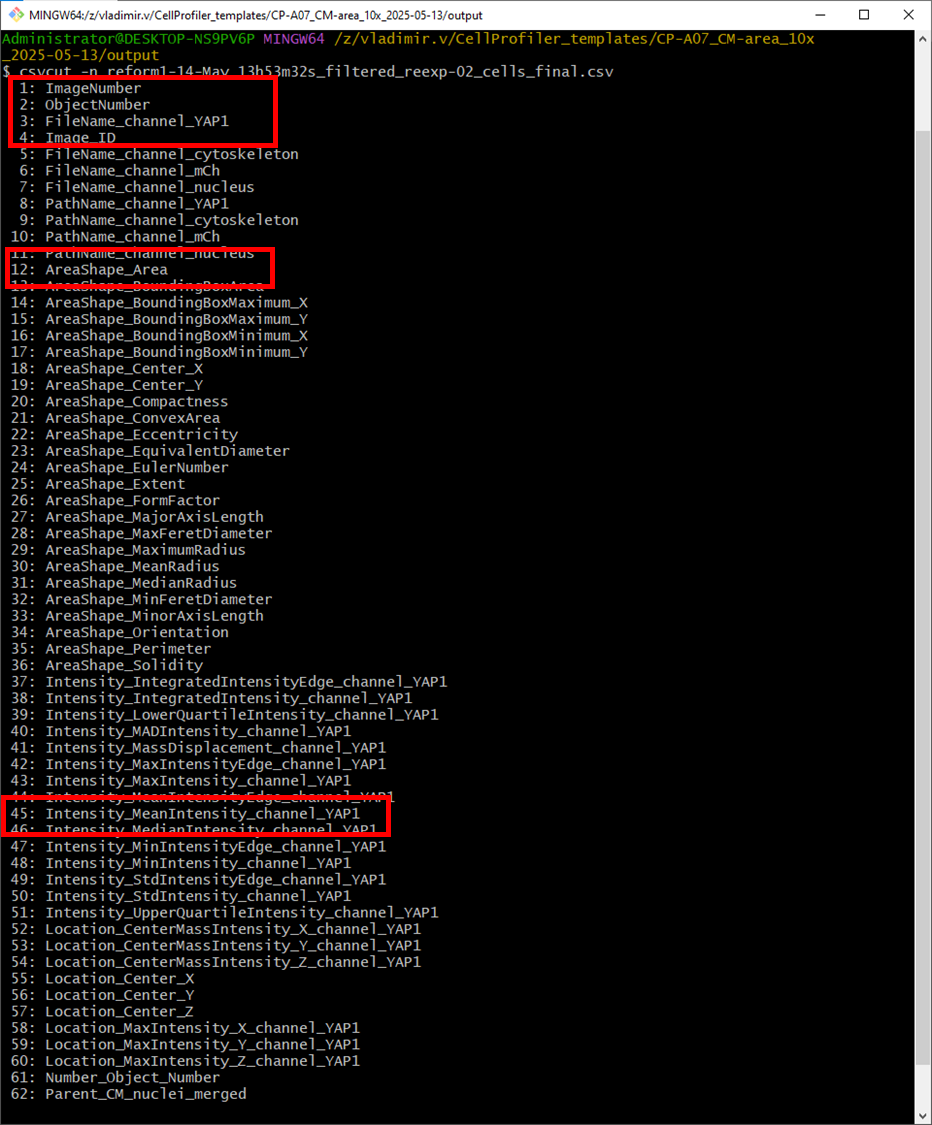
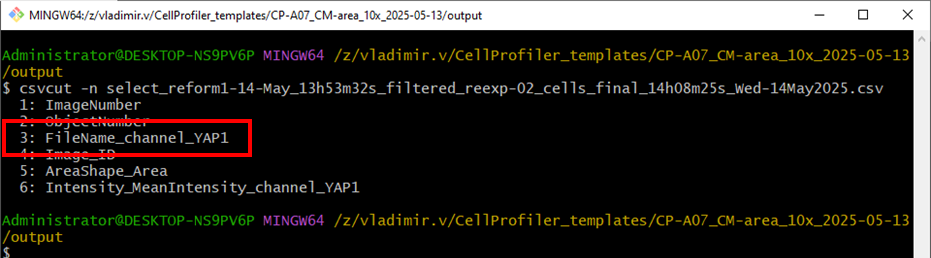
Get the names of columns to select only the relevant ones using csvcut -n <file>
Decide which columns are relevant for further analysis (highlighted in red)
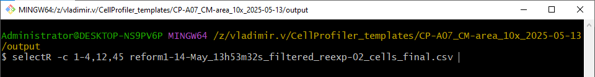
Save the relevant columns into a new file using select.R -c N,M-O <file>
Check the columns got selected
To get the final descriptive statistics (aka summary), select what columns describe the experimental condition (here it is the the column number 3)
First check the number of columns using csvcut -n <file>
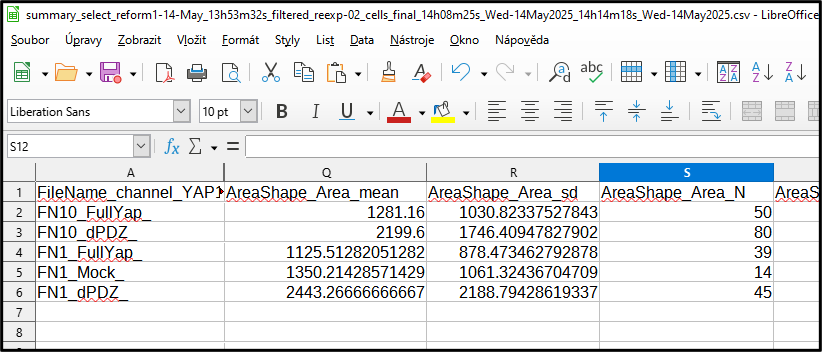
Make a summary statistics using the summaryR -c <file> targeting the third columns

The output file contains statistics for each numerical column
In first, last, mean, sd and N is calculated for each group
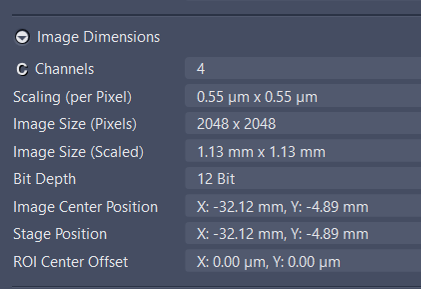
Acquisition setting
Resources
Pipeline location on Leica computer